
I have often needed to obtain a series of data sent through a serial port in projects, for example, from a microprocessor like Arduino, ESP8266, or ESP32. However, I have not found software, free or commercial, that meets my needs.
This is how LiveSerial came about, a program that allows graphing and performing statistics of the data obtained through the serial port in real time, and exporting the data obtained to various formats.
Another advantage of LiveSerial is that it stores the instant when the values are received. Thus, the graphs have a temporal X axis (instead of most serial plotters that show the values “all together”).
LiveSerial is programmed in C# + WPF, and is available on Windows 7-10. As we know, Windows is not a real-time system, and that has certain consequences. The first is that we may have delays in receiving some values. Therefore, there are two operating modes, normal and synchronous, where in the latter the microprocessor marks the time of each point by sending the time (millis()).
Another consequence is that LiveSerial has a relatively limited maximum sampling rate. It is not designed to, for example, be an oscilloscope. The refresh rate you can obtain depends on your computer, but expect a maximum of 20-50 samples per second.
Using LiveSerial
The main idea of LiveSerial is that it is minimally intrusive with the microprocessor code. No library or complex code is required. We have two operating modes:
Normal mode
To communicate with LiveSerial, we only have to send a command in the format through the serial port
ID:valueWhere:
- ID is the name of the series
- Value is the numerical value to store
For example,
Temp1:257.8When LiveSerial receives a new ID, it creates a new series, adds it to the existing ones, and begins recording.
Synchronous mode
In the “normal” mode, the date and time of the point is the instant it is received by the computer. However, as we said, Windows is not a real-time system, so depending on the OS load, there may be variations in milliseconds from the send.
An example is to try to maximize or change the size of LiveSerial, or run another program while it is receiving data. You will see that the graph is deformed, due to the delay that the OS causes in handling the data received through the serial port.
In many cases, the “normal” mode is sufficient, but in certain cases where greater precision is required, it is possible to send the time stamp from the microprocessor with the command.
ID:value@millisWhere,
- ID is the name of the data series
- Value, the numerical value to store
- Millis, the milliseconds sent from the processor
LiveSerial collects the data and adjusts it, taking into account the time stamps sent by the microprocessor, so that the time scale is adjusted precisely.
Messages
Data received through the serial port that do not contain the series identifier (by default ’:’) are interpreted as “messages”. These are displayed in their own window.
It is also possible to send messages to the microprocessor. These messages are recorded and displayed in their own window.
Macros
While it is not necessary to use any library to use LiveSerial in the processor, the following macros are provided to make it easier to use.
// normal mode

#define LIVESERIAL(id, value) { Serial.print(id);  Serial.print(':');  Serial.println(value); }

// synchronous mode

#define LIVESERIAL_MILLIS(id, value) { unsigned long ms = millis(); Serial.print(id); Serial.print(':'); Serial.print(value); Serial.print('@'); Serial.println(ms); }These macros are available as a reminder in LiveSerial by pressing the ”?” button
User Interface
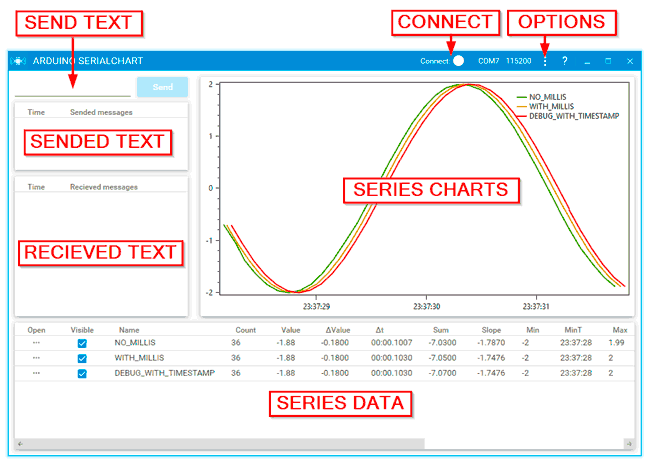
Connect
To connect LiveSerial, use the sliding button at the top of the window. If no port is selected, open the options tab to reload the serial ports.
Graph area
Here, the N last received values are displayed in a graph (the number of elements shown is controlled from the options to avoid saturating the program).
Messages area
From here we can send messages through the serial port, as well as view the messages sent and received.
Statistics area
As data from the series is received, their statistics are calculated in real time. These statistics are:
- Name, name of the series
- Count, total number of received elements
- Value, last received value
- ΔValue, increase compared to the previous value
- Δt, temporal increase compared to the previous one
- Sum, total sum
- Slope, slope of the last elements
- Min, minimum received value
- Max, maximum received value
- Range, difference between Max and Min
- MinT, time of the first received data
- MaxT, time of the last received data
- Peak, value of the last peak recorded
- PeakT, time of the last peak recorded
- Interval, time difference between the last two peaks
- Frequency, frequency based on the last two peaks
View data and export data
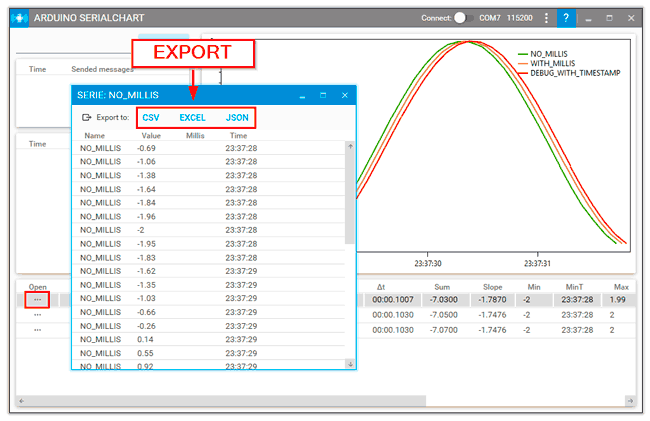
We can view all the received data by clicking on the icon of the series. A new window will open showing the data of the series.
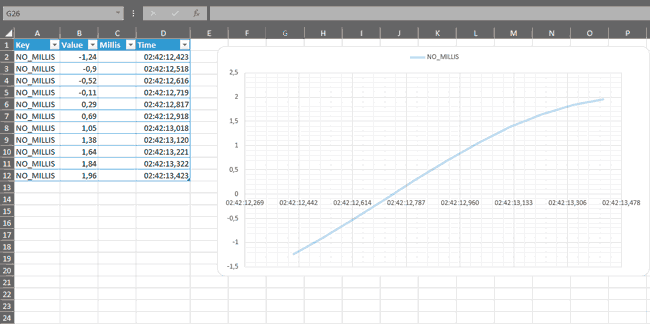
From this window, we can choose to export to various formats, CSV, JSON, and Excel. In the case of Excel, the exported sheet contains the data and a graph of the values.
Options
By pressing the options button, we access the window to modify them. The options are saved from one program execution to another, per user.
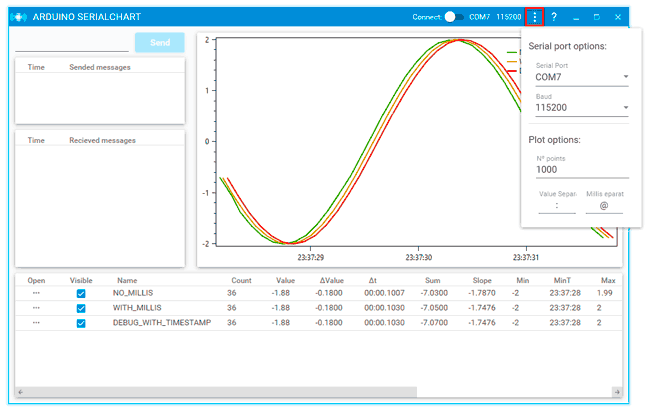
First, we have the serial port and transmission speed we want to use.
On the other hand, we have the number of elements (per series) to graph. As the graph increases in the number of points, the processing load increases, especially if we have many series. Therefore, only the N last received elements are graphed.
For example, in the case of a single series, values of 1000-1000 are frequent, but if we have several series, we may have to lower it to 100-500, or we will overload the program.
Finally, we can change the default separators ’:’ and ’@’ to any other character.
Example of use
An example of using LiveSerial with Arduino would be the following:
#define LIVESERIAL(id, value) { Serial.print(id);  Serial.print(':');  Serial.println(value); }

#define LIVESERIAL_MILLIS(id, value) { unsigned long ms = millis(); Serial.print(id);  Serial.print(':');  Serial.print(value);  Serial.print('@');  Serial.println(ms); }

void setup() {
  Serial.begin(115200);
}

void loop() {
    while(Serial.available())
    {
      Serial.print((char)Serial.read());
    }

    LIVESERIAL("NORMAL", 2.0*cos(millis()/500.0));
    LIVESERIAL_MILLIS("WITH_MILLIS", 2.0*cos(ms/500.0));
    delay(100);
}This example graphs two sine functions, one with “normal” mode and the other with “synchronous” mode.
In addition, the program emits everything it receives. This way you can try sending messages, receiving them, even trying to send new series in real time (sending an ID
TO-DOs
- Triggers: Actions performed when the value of a series meets a condition
- Scripts: Command files that are executed sequentially by LiveSerial
Code
All the code is available on Github at https://github.com/luisllamasbinaburo/Arduino-LiveSerial, and the binary files at https://github.com/luisllamasbinaburo/Arduino-LiveSerial/releases.