The new version 1.6.6 of the Arduino IDE has just been released, and one of the most celebrated new features is the inclusion of a window for creating graphs with the values received from the serial port.
In this post, we will see how to use this simple but useful tool, called “Serial Plotter,” to visualize information sent from Arduino via the serial port.
Arduino Serial Plotter
As mentioned, the new Arduino IDE incorporates an extension to the traditional serial monitor, which allows real-time graphing of the values received from the serial port.
Don’t expect wonders… it’s a simple tool, far from what we can achieve by connecting Arduino with a Processing, C#, Python, or Java application (some of which we will cover in the blog soon).
But precisely this simplicity and ease of use is what makes the serial plotter useful, as it allows us to perform quick tests or monitor the values of a variable effortlessly.
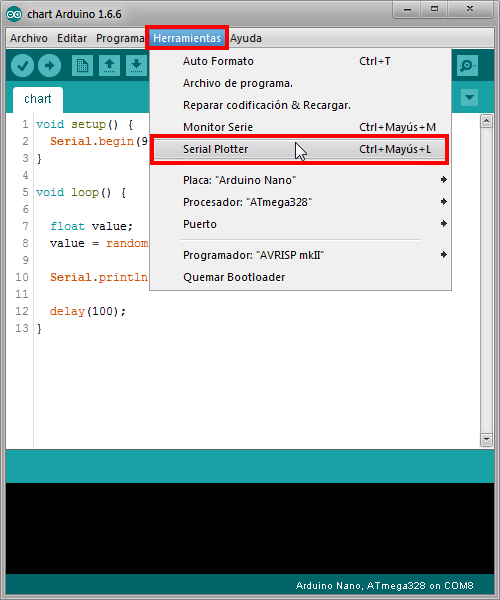
We find the new Serial Plotter in the menu Tools, right next to the traditional Serial Monitor.

Let’s demonstrate its use with a simple example. To do this, we start by connecting Arduino via USB, as we saw in the post Arduino Communication with Serial Port.
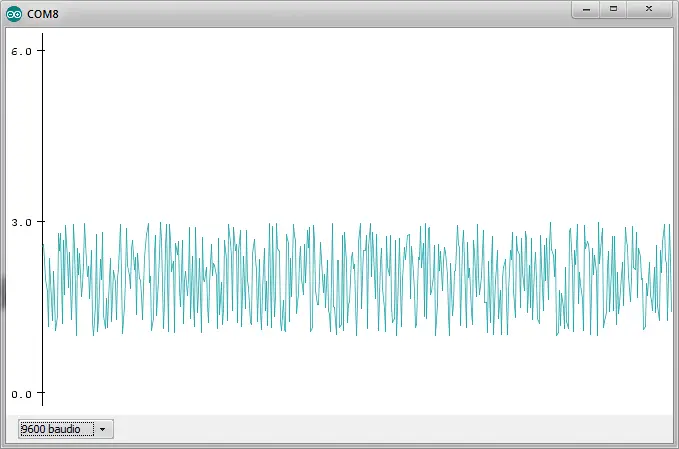
We load the following code onto Arduino. It simply generates random numbers between 1 and 3 with two decimal places and sends them via the serial port every 100 ms.
void setup() {
  Serial.begin(9600);
}

void loop() {

  float value;
  value = random(100,300)/100.0;

  Serial.println(value);

  delay(100);
}
The result you will obtain is similar to the following image.

Of course, in a real application, the displayed value would be a monitored variable such as, for example, the measurement taken using one of the many sensors we have seen in the blog. Similarly, we should adjust the time between transmissions to the desired measurement frequency.
We see that, despite its limitations, it is a tool that is useful for its simplicity in performing quick tests and setups. We hope that future versions will improve and add new functionalities to the Serial Plotter.
Download the code
All the code from this post is available for download on GitHub.

