
Today is a strike day and, as usual, electricity demand is on everyone’s lips as a parameter to estimate and compare its impact. And, also as usual, the dance of numbers has begun, where each interest group presents the data as it suits them.
We are used to this dance by now. But, unlike other occasions, electricity consumption figures are objective and indisputable data. In this post, we will handle the data points as objectively as possible, so that everyone can draw their own conclusions.
Before getting into the data, it’s necessary to make it clear that interpreting demand data is not as simple and straightforward as the media says. For those who want to delve deeper into the topic, here are some considerations below:
:::spoiler intro=“Previous Considerations” Electricity demand depends heavily on many factors, ranging from the most obvious, such as the season or the day of the week, to much less obvious ones, like a World Cup final being held. All these factors must be taken into account when making estimates, analyses, or comparisons between different time periods.
- Logically, the time of day and the day of the week.
- Weather. Temperature and seasons have a strong influence on demand, as they involve the switching on and off of climate control systems (heating and air conditioning). Generally, cold days have higher electricity demand.
- Lighting conditions, which vary throughout the year and, occasionally, on cloudy, foggy days, etc. They lead to an increase in demand due to the switching on of both public and private lighting systems.
- Other specific events, such as holidays (Easter, etc.) or even something as seemingly innocuous, as we mentioned, as television programming.
All these elements affect demand, and one must be especially careful when choosing the time period for making comparisons and analyses.
On the other hand, when using demand as an estimator of human activity (or strike participation), we must understand that it encompasses different types of consumption, and it’s not possible to distinguish between them without more data. These consumptions are:
- Consumption not associated with activity, i.e., machinery that operates autonomously, for part or all of the day. For example, traffic light lighting, pumping equipment, etc. Public lighting (streetlights) is a special case because it represents significant demand, and it only operates during the night period, and not even constantly throughout the year.
- Consumption associated with non-interruptible activity, i.e., jobs that cannot be abandoned. For example, control centers, medical emergencies, minimum services.
- Industrial consumption, directly associated with productive activity. In turn, it can be continuous throughout the day (in large companies with night shifts) or only during the daytime period.
- Non-industrial consumption, associated with commercial sector activity, services, etc. Mostly during the daytime period.
- Domestic consumption, associated with non-work human activities, such as getting up, turning on the light, and making coffee.
It is foreseeable that, in the event of a strike, part of the demand associated with industrial, tertiary, or commercial activity will ‘convert’ into domestic consumption. At the same time, constant consumptions (which do not depend on people) and part of the ‘non-interruptible’ work will remain. It is therefore necessary to compare the data both with a normal working day and with the nearest holiday.
Finally, and equally important, it is not true, a priori, that the participation rate in electricity demand is linearly related to the participation rate in terms of the number of people. For example, a small workshop or store may have a large number of employees (20-30) and, due to its activity, a relatively small consumption. However, a factory may have a much higher consumption due to the use of large machines and, precisely because of the existence of these large machines, a much lower employee/demand ratio than a smaller or less automated facility.
Therefore, a (for example) 10% reduction in energy does not imply a 10% reduction in the number of people working. It could be more or less, depending on which sectors have been most impacted. In the absence of more data, it can be assumed that, on average, the relationship holds, but it must be kept in mind that it is an estimate that is not necessarily true. :::
With that said, I hope I have made it clear that electricity demand is an estimator of industrial activity, just as the number of vehicle trips or the volume of banking transactions can be. But being an indicator does not necessarily imply a direct and evident relationship between demand and strike participation, or that comparisons between different periods are straightforward.
Once clarified, I will now show the data, which has been obtained from the page https://demanda.ree.es/demanda.html, where the data is available for public access. The people at the electrical grid have very intelligent statisticians who calculate the hourly demand forecast each day to prepare the startup of power plants. We are going to use these estimates versus actual consumption to determine the consumption decrease.
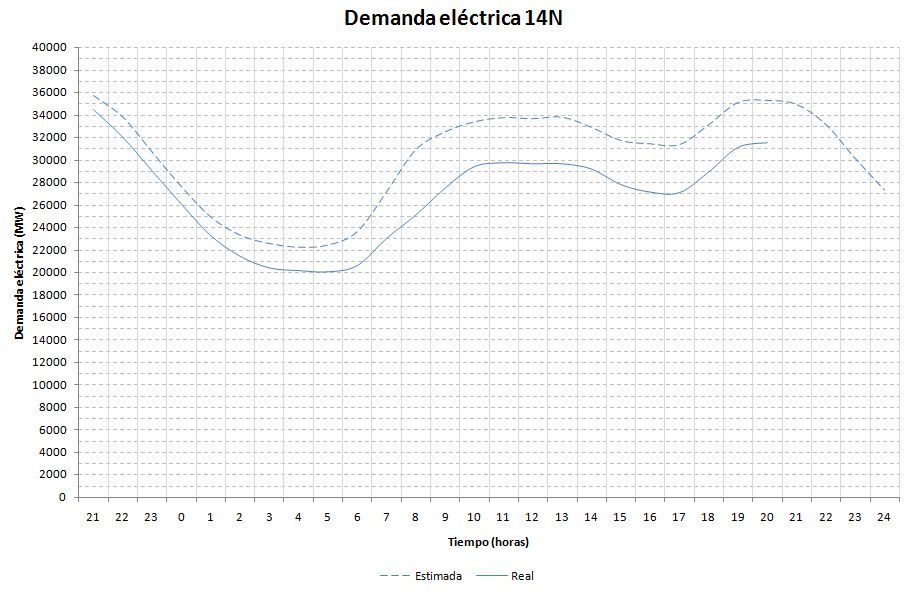
First, I show you the graph of hourly electricity demand for the 14N general strike. The estimated demand is what would correspond to normal operation without a strike, and the real demand is what was actually consumed. (click on the images to enlarge)
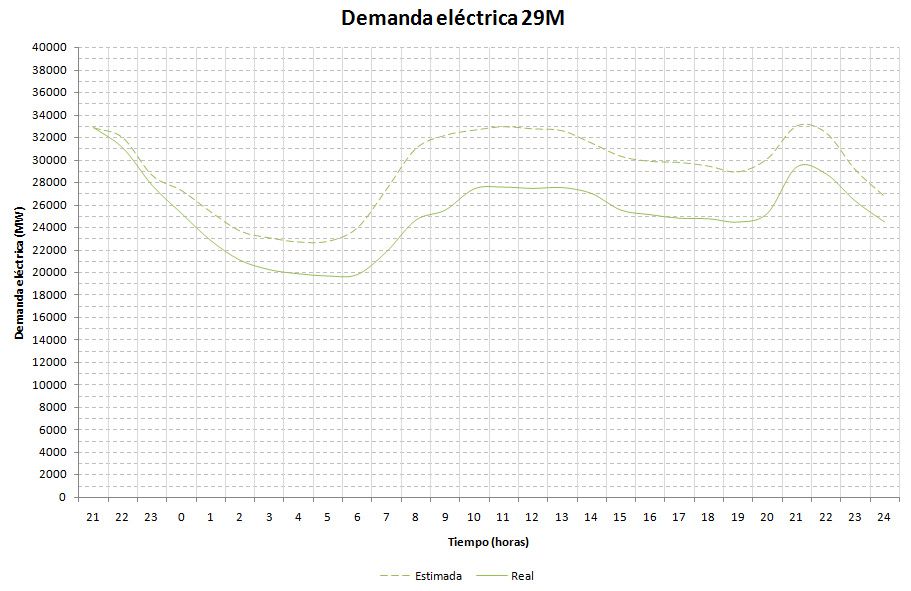
Next, I show you the same hourly demand graph for the 29M general strike.
Finally, the following graph compares the reduction in demand, as a percentage relative to the estimated demand, for each hour, in both strikes.
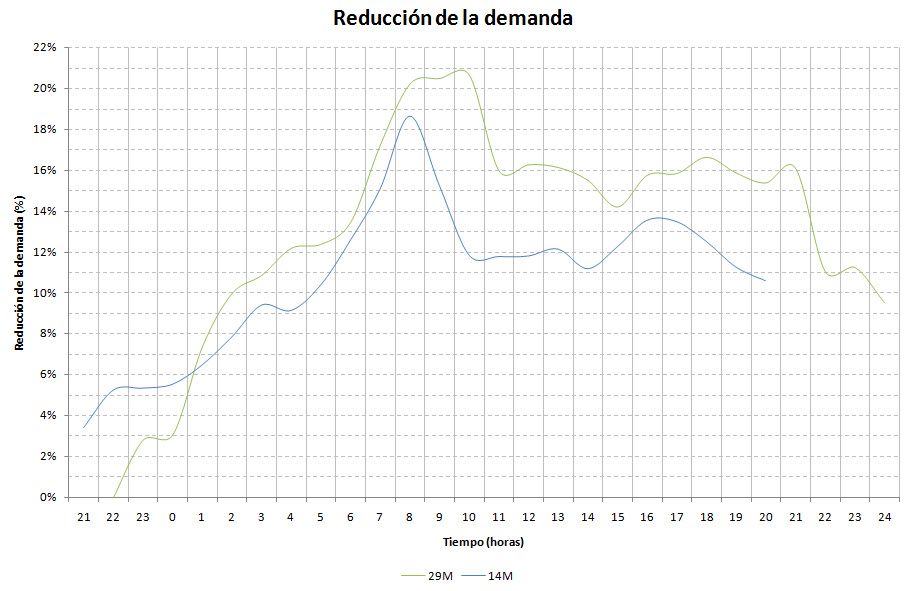
Taking a period from 8 am to 6 pm as representative of most of the population, it is estimated that the average decrease in electricity demand was 13% for the 14N strike and 16% for the 29M strike.
Finally, I will say, as a curious fact, that although the participation in this strike has been somewhat lower, it has lasted longer in terms of hours. In the 29M strike, the demand started to deviate at 21:00 on the 28th and normalized at 04:00 on the 30th. However, in the 14N strike, the deviation started at 18:00 on the 13th, and it is not expected to normalize until 6 am on the 15th.
These are the cold and objective facts. What is your opinion? Has your perception of participation been different? Do you think the data reflects reality? If you want to leave us a comment, you are invited.