Developer Tools (simply DevTools) are tools integrated into modern browsers to make developers’ lives easier.
They allow us to analyze, debug, and optimize both JavaScript code and other elements of your web applications.
In web development, they are going to become your best friends. Learning how to use them will save you time and effort when solving problems or improving your code.
So let’s take a look 👇
Accessing DevTools
You can open DevTools in several ways, depending on the browser you use. Here are some of the most common methods:
- Right-click anywhere on the page and select Inspect.
- You can also use the keyboard shortcut Ctrl + Shift + I (Windows) or Cmd + Option + I (Mac).
- Right-click > Inspect
- Or the shortcut Ctrl + Shift + I (Windows) or Cmd + Option + I (Mac).
- First, you must enable developer tools in the advanced preferences.
- Then, right-click > Inspect Element.
In general, Ctrl + Shift + I or F12 are almost standard.
Main DevTools Panels
Once opened, you’ll see an interface divided into panels, each with a specific functionality. I’ll explain the most important ones for working with JavaScript.
Console Panel
In the Console Panel, you can interact directly with the browser’s JavaScript interpreter by typing commands.
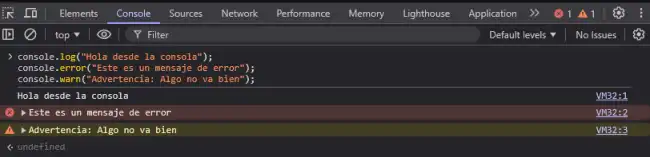
It’s also where errors, warnings, and messages you’ve logged using console.log are displayed.
For example, you can try copying and pasting this:
console.log("Hello from the console");
console.error("This is an error message");
console.warn("Warning: Something is not right");
In the console, you can test code snippets in real-time, debug errors, and analyze your application’s behavior.
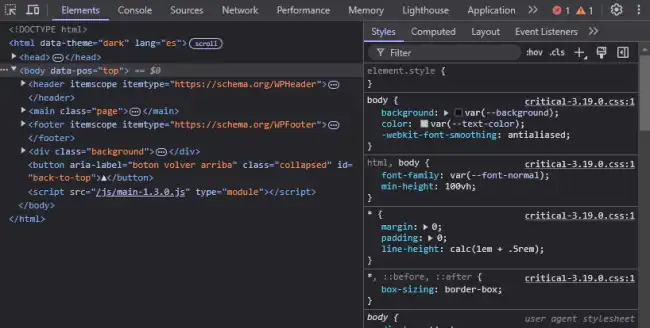
Elements Panel (DOM and CSS)
The Elements panel allows you to inspect and modify the DOM and CSS of a page in real-time.
- You can select elements on the page to see their properties.
- You can also modify styles directly from here and see the changes instantly.
Debugging Panel (Sources)
The Sources panel allows you to debug your JavaScript code.
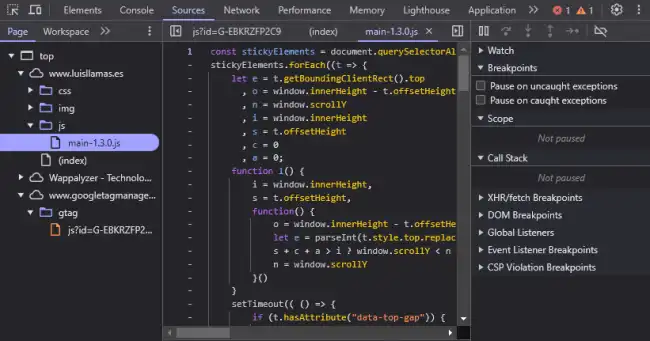
This panel allows you to:
- Set breakpoints to pause code execution at specific moments.
- Examine variables and their state in real-time.
- Navigate between the different files and scripts loaded by your application.
function add(a, b) {
  debugger; // This pauses execution here
  return a + b;
}

add(3, 4);
By writing debugger in your code, you can pause execution and analyze the value of variables at that moment using the Sources panel.
Network Panel
The Network panel shows all requests made by your application, including HTML, CSS, JavaScript files, images, and AJAX requests.
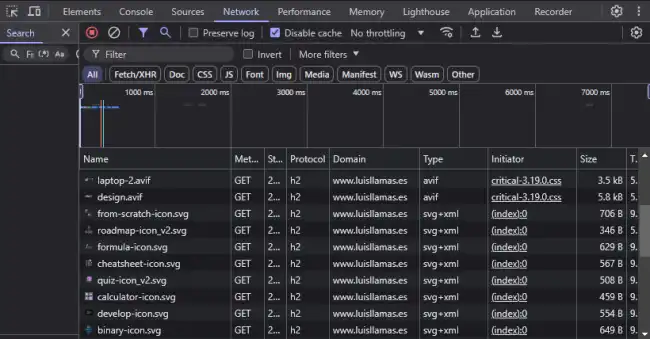
Here you can:
- Check load times.
- Inspect data sent and received in API requests.
- Identify errors in responses.
Performance Panel
The Performance panel allows you to measure and analyze the performance of your page. Here you can:
- Record rendering time.
- Identify bottlenecks in your code’s execution.
- Improve loading speed and interaction.
If your application is slow, this panel is your best friend for finding the cause and optimizing it.
General Tips
- Experiment without fear: You can modify styles and elements directly in DevTools without affecting your original code.
- Use the debugger: It will allow you to analyze step-by-step what is happening in your code (without having to use console.log so much).
- Filter messages in the console: If you have too much information, use filters to focus on specific errors or warnings.
- Analyze HTTP requests: Use the Network panel to detect errors in communication with APIs.